Increased sensitivity of detecting and monitoring plasma cell disorders using MS
Plasma cell disorders are detected in the clinical lab by finding the monoclonal immunoglobulin (M-protein) they produce. Serum protein electrophoresis methods have been employed widely to detect and isotype M-proteins. Increasing demands to detect residual disease and new therapeutic monoclonal immunoglobulin treatments have stretched electrophoretic methods to their limits. Newer techniques based on mass spectrometry are emerging which have improved clinical and analytical performance. These techniques are beginning to gain traction within routine clinical lab testing.
by Dr David L. Murray
Background
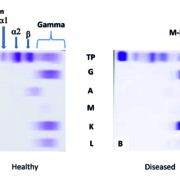
In a healthy immune system, the terminally differentiated white blood B-cells (i.e. plasma cells) each produce a unique immunoglobulin (Ig, or antibody) which was selected for by its fitness to bind to foreign invaders (antigens). This legion of plasma cells resides within our bone marrow and serves as a protective library manufacturing a diverse protective cacophony of Ig proteins whose aim is to protect us from recurrent infections. The total production of Igs in a healthy individual is remarkably highly regulated in the non-infected state with no particular plasma cell out-producing other plasma cells. As a result, the electrophoretic separation of healthy human serum results in a cathodically broad distribution of Ig proteins, which is labelled the gamma region (Fig. 1a).
In contrast, plasma cell proliferative disorders (PCDs) consist of a group of diseases stemming from clonal proliferation of a dysregulated plasma cell clone. PCDs range from relatively common benign conditions, such as monoclonal gammopathy of undetermined significance (MGUS), to frank malignant conditions, such as multiple myeloma (MM) [1]. Central to the detection of PCDs in serum is the detection of the over-produced monoclonal Ig by the dysregulated plasma clone (termed M‑protein or paraprotein). M‑proteins are a relatively common laboratory finding occurring in approximately 3 % of adults over the age of 50 [2]. The majority of these patients will live unaffected by the presence of the M‑protein while some patients will progress to more serious disease, such as MM, at a rate of 1 % per year. Currently, it is not possible to know which patient is going to progress and patients with an M‑protein undergo surveillance for M‑protein concentration changes yearly.
Electrophoresis-based assays
By nature, M‑proteins are heterogeneous and thus diverse methodologies are currently used to detect, characterize and quantitate serum M‑proteins in the clinical laboratory. Serum protein electrophoresis (PEL) was the first method available to detect and quantitate M‑proteins. To increase the specificity and sensitivity, a second technique known as immunofixation electrophoresis (IFE) enables establishment of M‑protein isotype (IgG, IgA, IgM, IgD, IgE or free light chain kappa or lambda) by examining multiple electrophoretic gel lanes in which the serum proteins were ‘fixed’ to the gel using reagents specific for human immunoglobulin components
(Fig. 1). A third assay, the serum free light chain (sFLC) assay, uses specific antibodies for quantitation of circulating free kappa and lambda light chains. This assay has demonstrated superior detection of PCDs, such as amyloid light chain (AL) amyloidosis, which can result from low levels of circulating monoclonal free light chains [3]. Currently, the International Myeloma Working Group recommends a panel of serum tests that include PEL, IFE and a sFLC assay quantitation to maximize the sensitivity of PCD screening [4].
Need for improved detection sensitivity
At our institution, agarose gel electrophoresis methods (PEL and IFE) have been used for detecting M‑proteins since 1967. While the utility of the electrophoretic methods to screen and monitor PCDs has been well established, several changes in the treatment of PCDs are pushing these methods to their analytical limits. Dramatic improvement in the treatment response of MM patients to new chemotherapies and immunotherapies is challenging long-held assumptions about this ominous disease. In particular, there is renewed hope that MM may be curable and perhaps it is time to start treating MM patients until all signs of the disease are eradicated. The long-standing routine serum electrophoretic methods are not capable of providing the analytical sensitivity needed to assess minimal residual disease (MRD). A few laboratorians have turned to using bone marrow biopsies to hunt for traces of the malignant plasma cells by high sensitivity flow cytometry and next-generation sequencing [5, 6]. In addition, new monoclonal therapeutic antibodies (t‑mAbs) designed to eradicate malignant plasma cells are producing interferences making it difficult to distinguish between a patient’s M‑protein and the t‑mAb drug. A search for a more convenient serum-based test to complement bone marrow MRD detection and aid in resolving t‑mAb interferences was sought to address limitations in traditional testing. Mass spectrometry (MS) is aptly suited for this task as the improvements in MS instrumentation and techniques have resulted in increased resolution and mass accuracy that have outpaced improvements in electrophoresis.
MS-based methodsFor Igs, both the overall charge of the protein (the basis of electrophoretic separation) and the mass of the protein (the basis of MS separation) are diverse among Igs owing to Ig gene rearrangement in which the adaptive immune system optimizes the affinity of the antigen binding region of the Ig to its target antigen. The unique amino acid sequence of the antigen binding domain results in a unique molecular mass (and peptide sequence) which is the basis of the mass spectrometric detection. Efforts to optimize M‑protein detection by MS have resulted in two methods differing in the analytical target used to detect the M‑protein. One method based on a tryptic digest of Igs and using selective reaction monitoring (SRM) MS to detect unique peptides from the Ig antigen binding region (also termed the ‘clonotypic’ peptide approach) [7] and a second method based on disassembling Igs by chemical reduction and measuring the mass distribution of Ig light chain [termed monoclonal immunoglobulin Rapid Accurate Mass Measurement (miRAMM)] [8]. Of these two approaches, the miRAMM method was suitable for adaptation to our high volume reference laboratory. The adaptation of the miRAMM method to MALDI-TOF mass spectrometers [9] eliminated the need for chromatography and allowed for throughputs suitable for PCD screening. The simplicity of MALDI-TOF data files also allowed our lab to build software capable of rapidly displaying multiple spectra which can be automatically analysed for an M‑protein. The current clinically validated version of the assay consists of five separate immune-enrichments for IgG, IgA, IgM, kappa and lambda which are separately analysed and the light chain mass distributions are examined for a ‘spike’ in a similar fashion to gel electrophoretic densitometry (Mass-Fix; Fig. 2). Mass-Fix has demonstrated overall superior analytical and clinical sensitivity to serum IFE [9, 10]. Mass-Fix has been automated and validated as a laboratory developed test and our one-year experience has confirmed that the assay is robust, sensitive and more labour efficient than our traditional gel IFE assay.
One of the benefits of using Mas-Fix over electrophoresis is the ability to determine a fundamental feature of the M‑protein, its light chain mass. Reporting the light chain mass allows for a more specific description of M‑protein than is currently available by electrophoresis. Current reporting of serum electrophoresis allows for placing an M‑protein within a region of the electropherorgram (alpha, beta or gamma) which is less specific than reporting an IgG kappa M‑protein with a light chain mass of 23 425 Da. Using the mass of the M‑protein light chain could allow other clinical labs using MS to assess the same patient for over-expressed clones of the same light chain mass increasing the confidence of M‑protein identity. By measuring the mass of the light chain of a t‑mAb, the lab will be able to determining if the detected over-expressed clone is due to the presence of a t‑mAb (such as daratumumab) or the patient’s M‑protein [11]. Additionally, the mass of the M‑protein light chain detected in other body fluids, such as urine, was found to be the same as in serum. This again affords more specificity than is currently available by electrophoresis.
The Mass-Fix assay has also shed light on M‑protein structural features that were not previously appreciated using electrophoretic techniques. In particular, the presence of monoclonal Ig light chains with masses outside the expected mass range were encountered in a small subset of patients. These light chains also had broader mass ranges than typically encountered with M‑proteins. Additional work revealed these light chains contained N-linked glycosylation [12]. Furthermore, patients with light chain glycosylated M‑proteins were found to be more likely to have a rarer form of a PCD (AL amyloidosis) than patients without light chain glycosylation.
Challenges and future perspectives
Challenges remain for these new assays to gain broad acceptance in the medical field. One feature that facilitates acceptance is Conformité Européene (CE) or U.S. Food and Drug Administration (FDA) approval in a format that is scalable and generalizable to a majority of clinical labs. Electrophoretic methods were employed prior to the FDA 510K process and thus have been grandfathered into the FDA approval system. This will not be the case for newer MS assays and thus time will be needed to get FDA approval. With increasing sensitivity, hematologists have also expressed concern over the potential increase in the detection of pre-malignant benign condition MGUS, as this would increase the number of consults.
These challenges need to be assessed in light of the numerous clinical advantages. The addition of the mass measurement allows for simpler conformation of peak as to its origin: disease or t‑mAb, the discovery of new risk factors for the formation of AL amyloidosis, and the ability to standard the detection from lab to lab.
Figure 1. Traditional detection of M-protein by immunofixation electrophoresis. (a) Healthy human serum demonstrating the albumin, alpha 1, alpha 2, beta and the broad gamma region which results from the diverse repertoire of Igs with slightly differing amino acid sequences and hence overall charge. (b) A patient with a plasma cell disorder demonstrating a relatively restricted band in the gamma region with immunofixation with anti-IgG (G) and anti (K) consistent with an IgG kappa M-protein.
Figure 2. Comparison of traditional immunofixation results and the new Mass-Fix spectra. (a) Healthy human serum demonstrating broad gamma region of IFE (left) and normal Gaussian [LC+2] m/z distribution for all immune-enrichments (IgG (black top), IgA (black middle), IgM (black, lower), kappa (orange, all spectra) and lambda (blue, all spectra). (b) A patient with a plasma cell disorder demonstrating a relative restricted band in the gamma region consistent with IgG kappa (left) and a non-Gaussian distribution of light chains with a peak in the IgG light mass distribution (black top) along with same peak in the total kappa light chain mass distribution (orange).
References
1. Willrich MAV, et al. Clin Biochem 2018; 51: 38–47.
2. Kyle RA, et al. N Eng J Med 2002; 346(8): 564–569.
3. Katzmann JA, et al. Clin Chem 2009; 55(8): 1517–1522.
4. Dimopoulos M, et al. Blood 2011; 117(18): 4701–4705.
5. Martinez-Lopez J, et al. Blood 2014; 123(20): 3073–3079.
6. Rawstron AC, et al. J Clin Oncol 2013; 31(20): 2540–2547.
7. Barnidge DR, et al. J Proteome Res 2014; 13(4): 1905–1910.
8. Barnidge DR, et al. J Proteome Re 2014; 13(3): 1419–1427.
9. Mills JR, et al. Clin Chem 2016; 62(10): 1334–1344.
10. Milani P, et al. Am J Hematol 2017; 92(8): 772–779.
11. Mills JR, et al. Blood 2018; 132(6): 670–672.
12. Kumar S, et al. Leukemia 2019; 33(1): 254–257.
The author
David L. Murray MD, PhD
Department of Laboratory Medicine and Pathology, Mayo Clinic, Rochester, MN 55906, USA
E-mail: Murray.David@mayo.edu


